Menü
Telefon
+49 711 36591990
E-Mail
info@cat2026.medienplaner.de

Flow visualization

/

Smoke Study

 
Tracking down turbulences
 

Flow visualizations show the movement patterns of air in a room, allowing analysis and forecasting. They are therefore central requirements of the

GMP

guidelines as well as

DIN EN ISO 14644

and

VDI 2083.

High-quality flow visualizations are also becoming increasingly important for FDA inspections – a requirement that

CAT Group

fully meets.

Finding particle entries

Of course, we also take on this task following modification measures to your

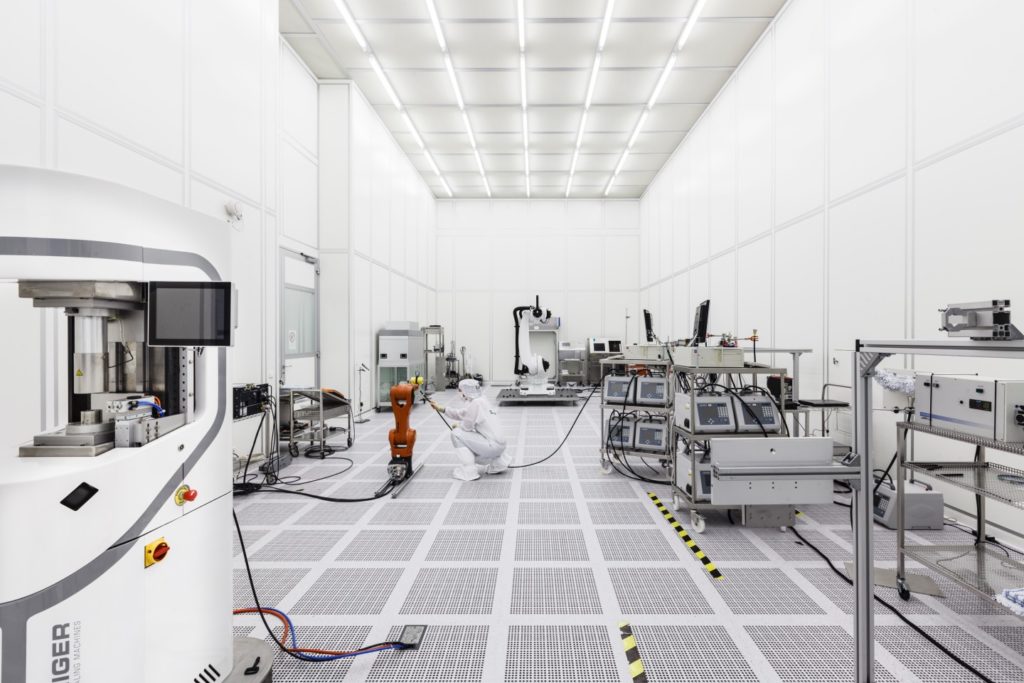
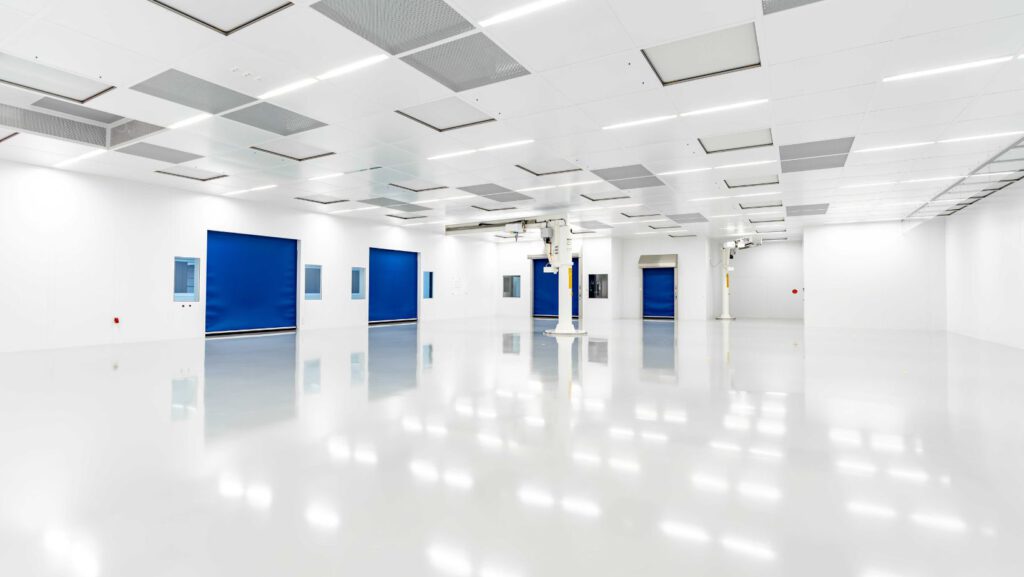
cleanroom technology

or when fixtures and machines have been adapted to the manufacturing processes of a new product. Also,

flow visualization

can help track down unexplained intrusion of particles.

CAT Group’s experts visualize the flow pattern on site using specially developed, state-of-the-art

fog generators

and based on a script defined together with the customer. The air stream impinged with residue-free fog is recorded with at least one high-resolution camera, which also detects the thinnest swaths and the finest turbulences.

You can download the sample visualization here (300 MB).

Are you planning a cleanroom project?

Get in Touch – No Obligation.

Service & contact

FAQs

  • Airflow visualization - often referred to as a smoke study - uses visible smoke to illustrate the movement of air within a cleanroom. This allows one to observe how the air flows and whether undesirable turbulence or potential contamination risks arise. As such, these studies are key requirements of the EU GMP guidelines as well as DIN EN ISO 14644 and VDI 2083.

  • Flow visualization can be just as useful during the commissioning and qualification of a cleanroom as it is after renovations, system modifications, or the installation of new machinery. It can also assist in identifying the causes of unexplained particle ingress.

  • First, the situations and process sequences to be examined are defined. Next, a suitable smoke plume is generated, and its movement is documented using cameras so that the flow behavior can then be analyzed.

  • Yes. The visualization can be documented and evaluated according to the project requirements. We coordinate the required scope of documentation with the client in advance.

  • Yes. Depending on the task at hand, different operating conditions can be examined. Visualization under conditions that closely resemble the eventual production process is often particularly informative.

  • If anomalies are detected, targeted optimization measures can be derived from them - for example, regarding airflow, equipment, process sequences, or technical components.

  • The CAT Group not only has extensive experience in the field of flow visualization - it has also developed and launched the CAT Pure Fog, a state-of-the-art fog generator.

    View references on flow visualization & smoke studies.
    View the CAT Pure Fog fog generator.

Other competences

Contact

Any questions? Simply contact us without any obligation. We will be happy to assist you with our reliable expertise.

  • CAT GROUP:
    CAT Clean Air Technology GmbH
    Motorstr. 51 | 70499 Stuttgart
    CAT e-tec GmbH
    Motorstr. 51 | 70499 Stuttgart
    CAT m-tec GmbH
    Motorstr. 51 | 70499 Stuttgart
  • info@cat2026.medienplaner.de
  • Tel: +49 711 3659199 – 0
    Fax: +49 711 3659199 – 99

    * required fields

    Thank you, we have received your message.

    close
    You love cookies?
    So do we! But of course, on our website you need to decide for yourself which cookies you will allow.

    We use cookies to ensure optimal user experience on our website. By continuing to use our website, you will give your consent to the use of cookies. In the settings, you can specify which types of cookies will be saved when using this website.
    You can also get additional information in our Privacy Policy.
    Cookie Settings